The biorhythm
Banks 5 and 6. It asks for two dates, the date of birth and the day to look at, and draws the three classic cycles: physical (23 days), sensitivity (28) and intellect (33).
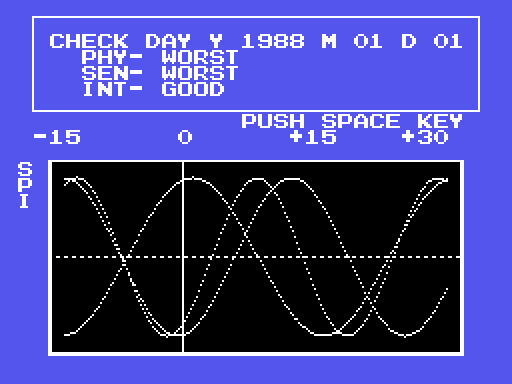
The sum
Each date is turned into days with the Gregorian calendar (p05:8E34): the year times 365, plus the leap years ((year-1)/4 - (year-1)/100 + (year-1)/400), plus the days up to the month (p05:959E) and one more from March in a leap year. The difference is the days lived; its remainder by 23, 28 and 33 is turned into degrees (remainder x 360 / cycle, p05:8FFB) and moved back 15 days (235, 193 and 164 degrees, p05:9043) so that the chart starts before today.
The height of each point comes from a sine table from 0 to 90 degrees (p05:94E8, p05:932F). Each column moves on 4, 3 and 2 degrees, with a correction every 4, 6 and 20 columns so that each day is worth what it should (p05:9179). There are 192 columns: from 15 days before to 30 after.
Today's level comes from the height: WORST, BAD, CAUTION, NORMAL or GOOD (p05:9DA5).
On MSX
The screen is SCREEN 2, but rows 10 to 23 have a different character in each square: a canvas where each point is drawn into the pattern of its character (p05:90DF). The letters S, P, I on the left show in which order the curves start (p06:A33D).
On MSX2
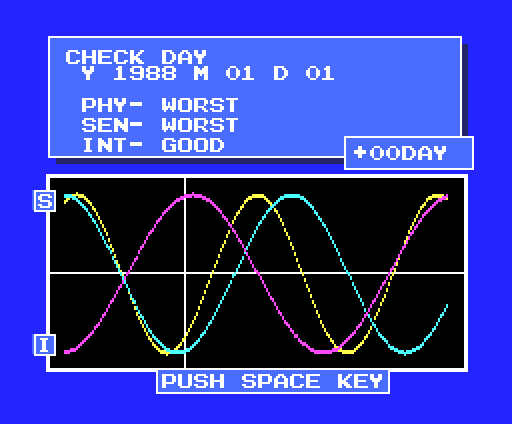
SCREEN 5 with shadowed boxes made with VDP commands, letters copied from a sheet on page 1 and the curves in colour: in each column, a two-dot line per cycle (p05:9249). The colours of the three curves fade in while the chart is on screen until they are yellow, cyan and magenta (p06:A2B7).
The dates in the pictures are examples: 1970-01-01 and 1988-01-01.